Contents:
- Overview
- Enable Amazon CloudWatch Logs
- Enable Container Insights
- Viewing Logs and Metrics
- Integrating Alerts (Alarms)
Overview
Monitoring and logging are essential for tracking the health and performance of your application and infrastructure.
In this workshop, we will use:
- Amazon CloudWatch Logs to store and analyze logs from containers.
- CloudWatch Container Insights to monitor CPU, Memory, Network, and Storage usage.
- CloudWatch Alarms to receive notifications when issues occur.
Enable Amazon CloudWatch Logs
- Go to ECS Console → Cluster → Select your service.
- In the Task Definition, check the log driver configuration:
- Select
awslogsas the log driver. - Log Group name:
/ecs/fargate-workshop - Region:
us-east-1(or your chosen AWS region).
- Select
- Save and redeploy the service.
Enable Container Insights
- Go to CloudWatch Console → Container Insights.
- Select Enable for your ECS Cluster.
- Container Insights will automatically collect:
- CPUUtilization
- MemoryUtilization
- NetworkRxBytes / NetworkTxBytes
- StorageReadBytes / StorageWriteBytes
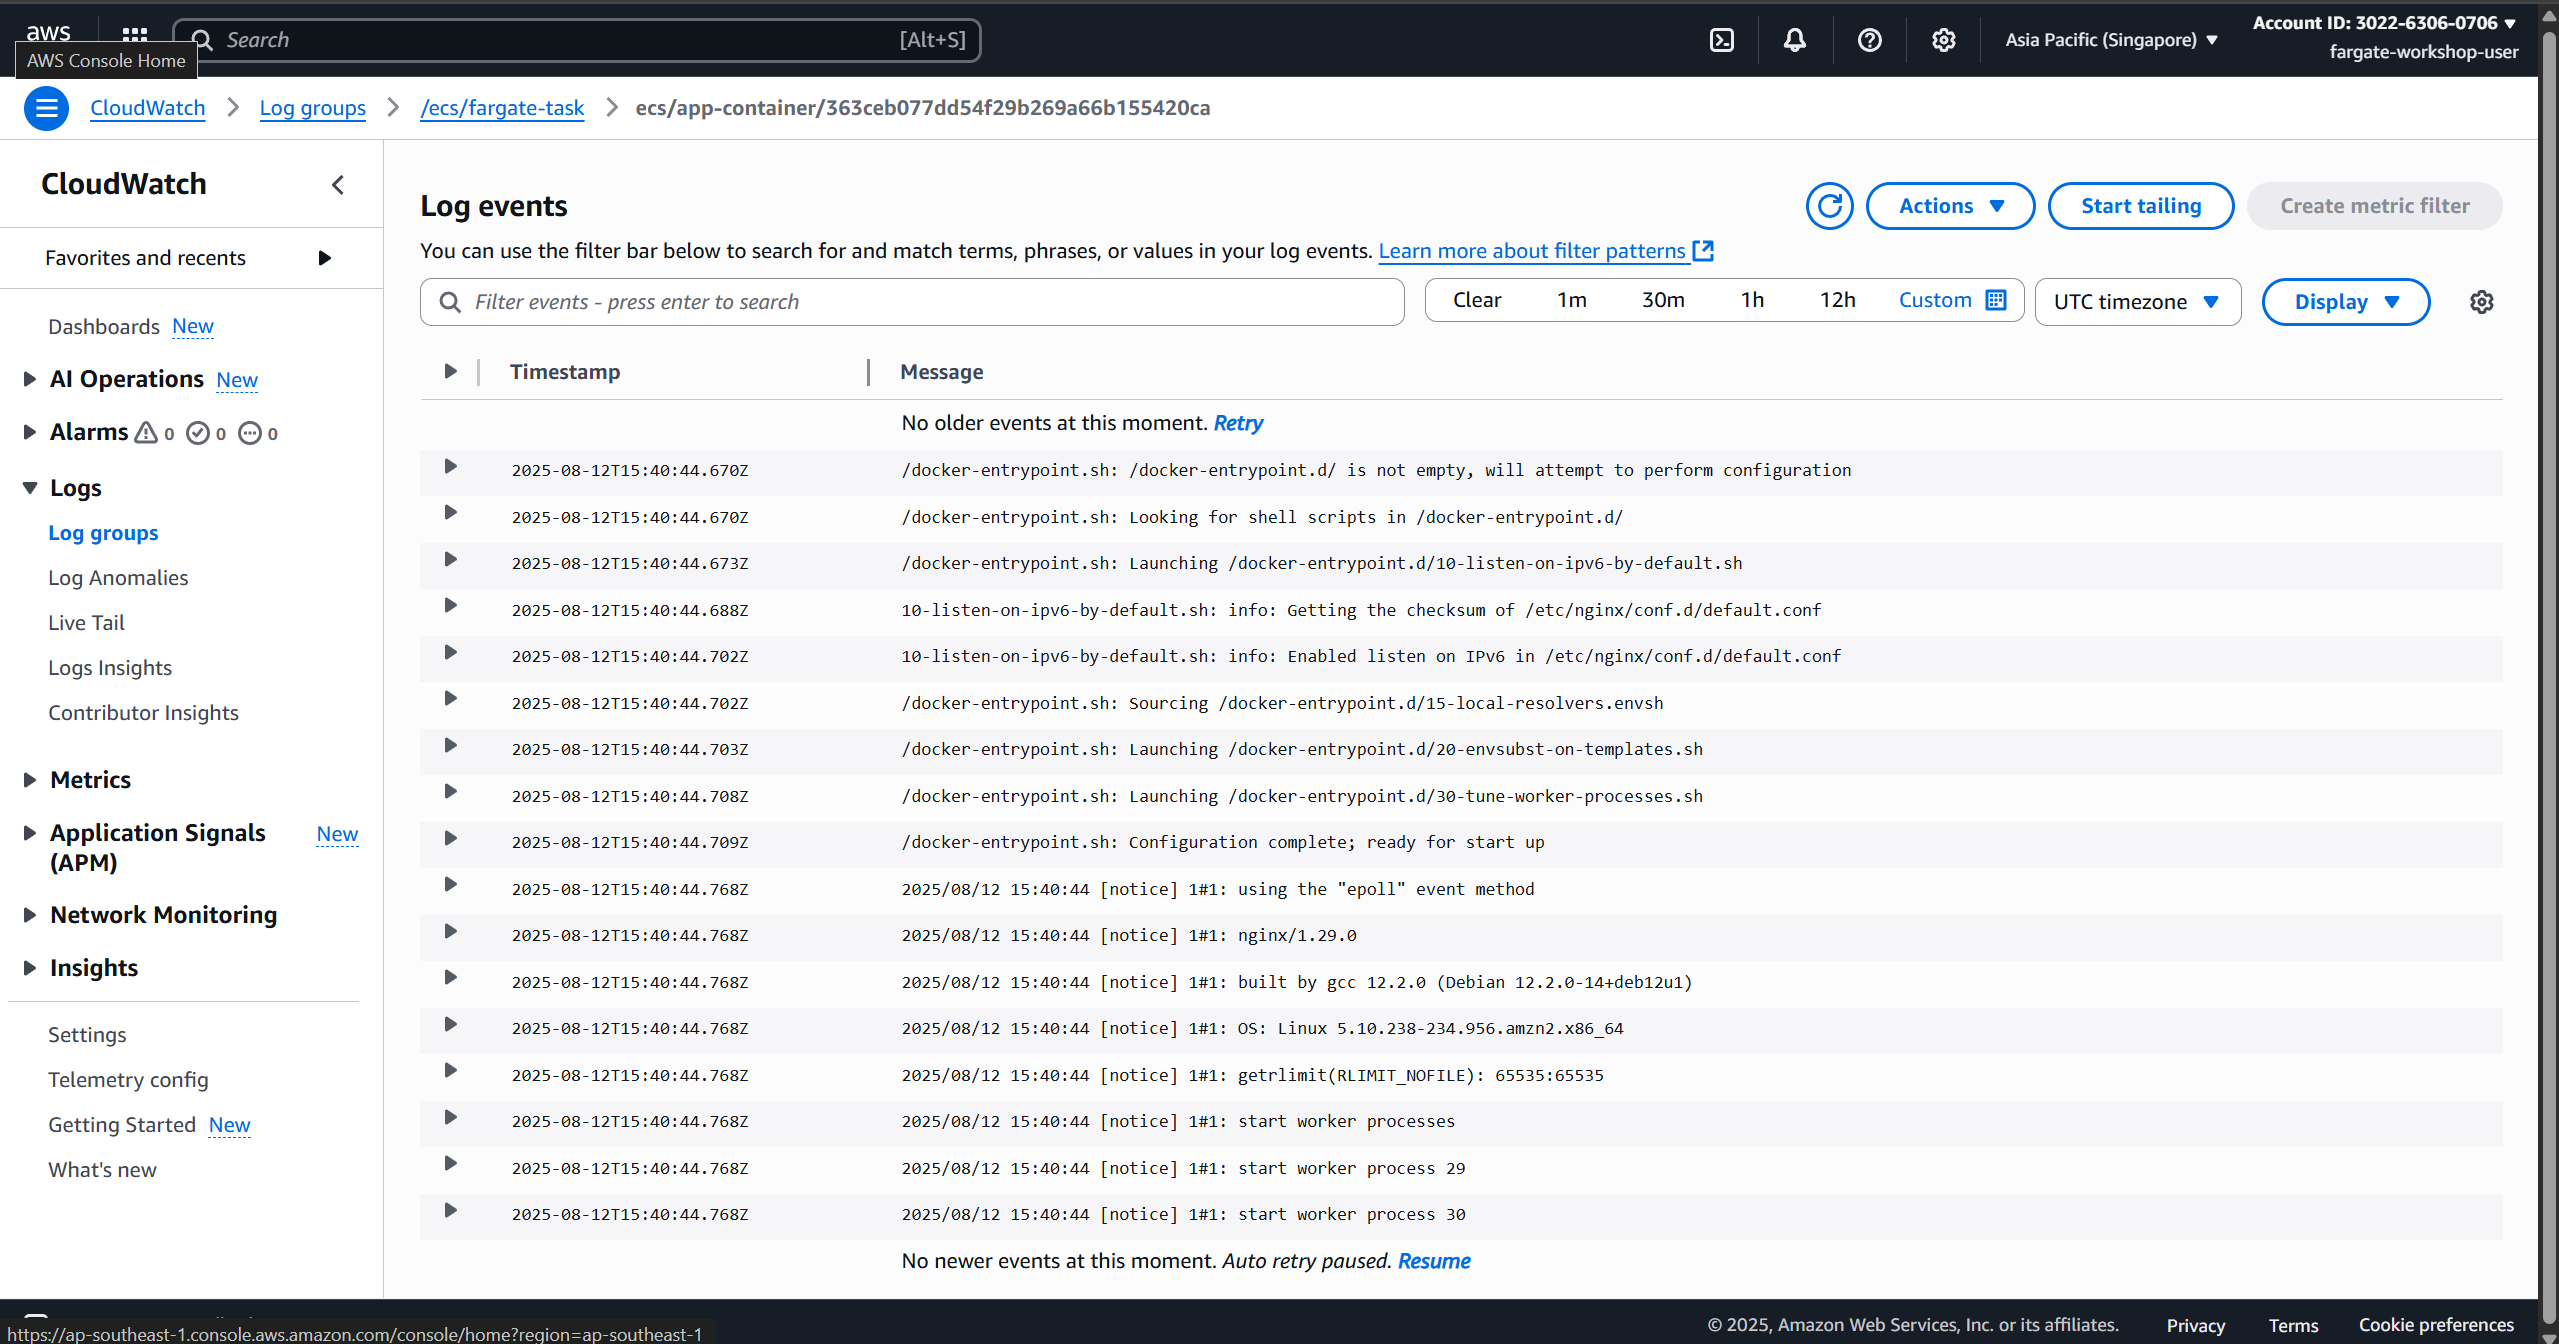
Viewing Logs and Metrics
- Open CloudWatch Console → Logs → Select the Log Group
/ecs/fargate-workshop. - View container logs (stdout, stderr).
- Go to CloudWatch Metrics → ECS → Cluster Metrics to see CPU, RAM, and Network statistics.
- Filter by specific services or tasks for detailed analysis.
Integrating Alerts (Alarms)
- Go to CloudWatch Console → Alarms → Create alarm.
- Select a metric, for example:
ECS/ContainerInsights – CPUUtilization. - Set a threshold, e.g., CPU > 80% for 5 minutes.
- Choose an SNS Topic to receive email notifications when the alarm is triggered.
- Save and activate the alarm.
Expected Outcome:
- You can view logs for each container to debug issues.
- Monitor application performance in real-time.
- Receive notifications when the system encounters issues or exceeds resource thresholds.